Querying or Reading Data
OpenTSDB提供一些手段提取、处理和分析数据. 数据可以通过CLI工具查询, 一个 HTTP API,并用GnuPlot 图形的方式绘制. 像Grafana 和 Bosun 这样的开源工具,也可以 获取TSDB数据. 查询OpenTSDB的标签为基础的系统,或许会有点棘手,通过阅读本文件和检验以下更深层次的信息页. 此页面上的示例查询遵循http API格式.
本页面提供了典型查询组件的快速概述. 有关每个组件的详细信息,请参见上面提到的文本页或上面的内容表.
查询组件
OpenTSDB随着时间的演变提供了许多工具和端点允许各种查询规范. 原来的语法允许简单的过滤、聚合和下采样. 后来的版本增加了对函数和表达式的支持。一般来说,每个查询都有以下组件:
| 参数 | 数据类型 | 要求 | 描述 | 例如 |
|---|---|---|---|---|
| Start Time | String or Integer | 必选 | 查询的起始时间. 这可以是绝对或相对时间. 查看日期和时间了解更多细节 | 24h-ago |
| End Time | String or Integer | 可选 | 查询结束时间.如果结束时间没有给定, 将使用现在TSD节点时间.查看日期和时间了解更多细节 | 1h-ago |
| Metric | String | 必选 | 监控项在系统中的全名.必须是完整名称,区分大小写 | sys.cpu.user |
| Aggregation Function | String | 必选 | 组合多个时间序列的数学函数 (i.e. 如何在一个组中合并时间序列) | sum |
| Filter | String | 可选 | 在标记值上过滤以减少查询或组中拾取的时间序列,并在各种标记上聚合. | host=*,dc=lax |
| Downsampler | String | 可选 | 一个可选的间隔和函数,以减少跨时间返回的数据点的数量。 | 1h-avg |
| Rate | String | 可选 | 计算结果变化率的可选标志,每秒 | rate |
| Functions | String | 可选 | 数据处理功能,如附加滤波,时间偏移等. | highestMax(...) |
| Expressions | String | 可选 | 跨时间序列的数据处理功能,如将一个系列划分为另一个系列。 | (m2 / (m1 + m2)) * 100 |
时间
绝对时间戳支持人类可读的格式或UNIX风格的整数. 相对时间用于清爽仪表盘. 目前, 所有查询都可以覆盖单个时间跨度. 在将来,我们希望提供一个偏移查询参数,允许在不同的时间段对一个度量进行聚合或绘图, 像比较上周到一年前. 查看Dates and Times了解更多细节.
因为OpenTSDB可以存储毫秒级数据, 大多数查询将返回具有第二分辨率的数据,以便为现有工具提供向后兼容性. 除非已用查询指定了向下采样算法, 使用查询中指定的聚合函数,数据将自动向下采样到1秒. 这样,如果为一个给定的第二个存储多个数据点,它们将在正常查询中正确地聚合和返回.
要实现毫秒级提取数据, 使用/api/query端点 并且指定msResolution(ms也可以,但并不推荐) JSON参数或查询字符串,它将绕过标签采样(除非指定)和返回在Unix格式毫秒分辨率时间戳. 而且, 命令行实用程序将返回存储在内存中的时间戳.
过滤器
每个时间序列由一个指标(metric)和一个或多个标签(tag)键值对组成.在OpenTSDB中, 过滤器应用于标签值 (这时候TSDB在指标和标签不提供过滤). 自从过滤器作为可选项在查询中提供后, 如果你只请求metric名称, then every metric with any number or value of tags will be returned in the aggregated results. Filters are similar to the predicates following aWHEREclause in SQL. For example, if we have a stored data set:
sys.cpu.user host=webserver01,cpu=0  1356998400  1
sys.cpu.user host=webserver01,cpu=1  1356998400  4
sys.cpu.user host=webserver02,cpu=0  1356998400  2
sys.cpu.user host=webserver02,cpu=1  1356998400  1
and craft a simple query with the minimum requirements of astart time,_aggregator_and_metric_such as:start=1356998400&m=sum:sys.cpu.user, we will get a value of8at1356998400that aggregates and groups all 4 time series into one.
If we want to zoom into a particular series or set of series, we can use filters. For example, we can filter on thehosttag via:start=1356998400&m=sum:sys.cpu.user{host=webserver01}. This query will return a value of5, incorporating only the time series wherehost=webserver01. To drill down to a specific time series, you must include all of the tags for the series, e.g. the querystart=1356998400&m=sum:sys.cpu.user{host=webserver01,cpu=0}will return1.
Note
Inconsistent tags can cause unexpected results when querying. SeeWriting Datafor details. Also see_Explicit Tags_below.
Read theQuery Filtersdocumentation for details.
Aggregation
A powerful feature of OpenTSDB is the ability to perform on-the-fly aggregations of multiple time series into a single set of data points. The original data is always available in storage but we can quickly extract the data in meaningful ways. Aggregation functions are means of merging two or more data points for a single time stamp into a single value.
Note
OpenTSDB aggregates data by default and requires an aggregation operator for every query. Each aggregator has to handle missing or data points at different time stamps for multiple series. This is performed via interpolation and can lead to unexpected results at query time if users are unaware of what TSDB is doing.
SeeAggregationfor details.
Downsampling
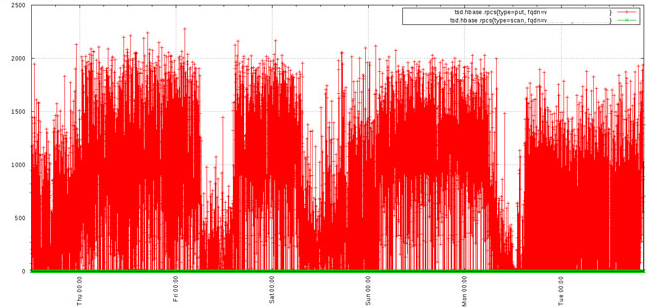
OpenTSDB can ingest a large amount of data, even a data point every second for a given time series. Thus queries may return a large number of data points. Accessing the results of a query with a large number of points from the API can eat up bandwidth. High frequencies of data can easily overwhelm Javascript graphing libraries, hence the choice to use GnuPlot. Graphs created by the GUI can be difficult to read, resulting in thick lines such as the graph below:

Downsampling can be used at query time to reduce the number of data points returned so that you can extract better information from a graph or pass less data over a connection. Down sampling requires anaggregationfunction and atime interval. The aggregation function is used to compute a new data point across all of the data points in the specified interval with the proper mathematical function. For example, if the aggregationsumis used, then all of the data points within the interval will be summed together into a single value. Ifavgis chosen, then the average of all data points within the interval will be returned.
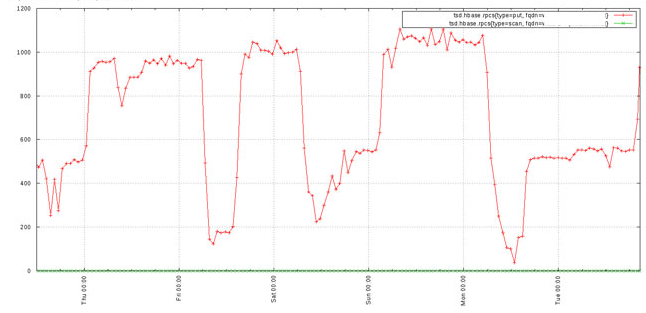
Using downsampling we can cleanup the previous graph to arrive at something much more useful:

For details, seeDownsampling.
Rate
A number of data sources return values as constantly incrementing counters. One example is a web site hit counter. When you start a web server, it may have a hit counter of 0. After five minutes the value may be 1,024. After another five minutes it may be 2,048. The graph for a counter will be a somewhat straight line angling up to the right and isn't always very useful. OpenTSDB provides arateconversion function that calculates the rate of change in values over time. This will transform counters into lines with spikes to show you when activity occurred and can be much more useful.
The rate is the first derivative of the values. It's defined as(v2-v1)/(t2-t1)where the times are in seconds. Therefore you will get the rate of change per second. Currently the rate of change between millisecond values defaults to a per second calculation.
OpenTSDB 2.0 provides support for special monotonically increasing counter data handling including the ability to set a "rollover" value and suppress anomalous fluctuations. When thecounterMaxvalue is specified in a query, if a data point approaches this value and the point after is less than the previous, the max value will be used to calculate an accurate rate given the two points. For example, if we were recording an integer counter on 2 bytes, the maximum value would be 65,535. If the value att0is64000and the value att1is1000, the resulting rate per second would be calculated as-63000. However we know that it's likely the counter rolled over so we can set the max to65535and now the calculation will be65535-t0+t1to give us2535.
Systems that track data in counters often revert to 0 when restarted. When that happens and we could get a spurious result when using the max counter feature. For example, if the counter has reached2000att0and someone reboots the server, the next value may be500att1. If we set our max to65535the result would be65535-2000+500to give us64035. If the normal rate is a few points per second, this particular spike, with30sbetween points, would create a rate spike of2,134.5! To avoid this, we can set theresetValuewhich will, when the rate exceeds this value, return a data point of0so as to avoid spikes in either direction. For the example above, if we know that our rate almost never exceeds 100, we could configure aresetValueof100and when the data point above is calculated, it will return0instead of2,134.5. The default value of 0 means the reset value will be ignored, no rates will be suppressed.
Order of Operations
Understanding the order of operations is important. When returning query results the following is the order in which processing takes place:
- Filtering
- Grouping
- Downsampling
- Interpolation
- Aggregation
- Rate Conversion
- Functions
Expressions